ChartFormat object – line, fill & effect formatting for chart elements: FillFormat object, LineFormat object, ShadowFormat object, GlowFormat object, SoftEdgeFormat object, ThreeDFormat object
Contents:
Setting ForeColor & BackColor for the Fill
Setting Gradient Type for the Fill
Gradient Stops – the End Points of Color Sections in a Gradient Fill
Setting Picture (Single Image) for the Fill
Setting ForeColor & BackColor for the Line Fill
Setting Style or Dash Style for a Line
Setting Pattern for the Line Fill
Transparency & Weight Properties of the LineFormat object
3-D chart view using Properties of the Chart object
Using the Format Property for various Chart Elements returns a ChartFormat object which contains the line, fill & effect formatting for that chart element. The ChartFormat object provides access to the new Office Art formatting options that are available in Excel 2007 so that by using this object you can apply many new graphics to chart elements using vba formatting. Manipulating 3-D Charts – the ThreeD Property of the ChartFormat Object returns a ThreeDFormat object which represents the three-dimensional formatting of the parent chart element, and this ThreeDFormat object contains 3-D effect formatting properties for that chart element.
This section explains hpw to use the properties of the ChartFormat Object to return: FillFormat object – contains fill formatting properties; LineFormat object – can be a Line itself or a border (where the chart has a border), contains line & arrowhead formatting properties; ShadowFormat object – represents a shadow & contains shadow formatting properties; GlowFormat object – represents a glow effect and contains glow formatting properties; SoftEdgeFormat object – represents the soft edges effect and contains soft edge formatting properties; ThreeDFormat object – represents the three-dimensional formatting and contains 3-D effect formatting properties.
The Format Property of a Chart Element object, say the Format Property of the ChartArea object (Syntax: objChartArea.Format), returns a ChartFormat object which contains the line, fill & effect formatting for the specified chart element, and provides access to the Office Art formatting options so that you can apply many new graphics to chart elements using vba. You can return a ChartFormat object by using the the Format Property with the Axis object, AxisTitle object, ChartArea object, ChartTitle object, DataLabel / DataLabels object, DataTable object, Gridlines object, DisplayUnitLabel object, ErrorBars Object, Floor object, LeaderLines object, Legend object, LegendEntry object, LegendKey object, PlotArea Object, Point object, Series object, TickLabels object, Trendline object, Walls Object, and so on.
We discuss some important properties of the ChartFormat object:
The Fill Property of the ChartFormat Object returns a FillFormat object for the parent chart element, and this FillFormat object contains fill formatting properties for that chart element. A fill can be solid, gradient, pattern, picture, texture or semi-transparent.
The Line Property of the ChartFormat object returns a LineFormat object for the parent chart element, and this LineFormat object, which can be a Line itself or a border (where the chart has a border), contains line & arrowhead formatting properties for that chart element.
The Shadow Property of the ChartFormat Object returns a ShadowFormat object which represents a shadow for the parent chart element, and this ShadowFormat object contains shadow formatting properties for that chart element.
The Glow Property of the ChartFormat Object returns a GlowFormat object which represents a glow effect by adding a vibrant colored edge around the parent chart element, and this GlowFormat object contains glow formatting properties.
The SoftEdge Property of the ChartFormat Object returns a SoftEdgeFormat object which represents the soft edges effect by creating a mask around and blending the chart element with the transparent edge resulting in a faded or soft edge, and this SoftEdgeFormat object contains soft edge formatting properties for the chart element.
The ThreeD Property of the ChartFormat Object returns a ThreeDFormat object which represents the three-dimensional formatting of the parent chart element, and this ThreeDFormat object contains 3-D effect formatting properties for that chart element.
The Fill Property of the ChartFormat Object (Syntax: objChartFormat.Fill) returns a FillFormat object for the parent chart element, and this FillFormat object contains fill formatting properties for that chart element. A fill can be solid, gradient, pattern, picture, texture or semi-transparent. Some of these properties are: FillFormat.BackColor Property – to return or set the fill background color; FillFormat.ForeColor Property – to return or set the fill foreground color; FillFormat.Pattern Property – to return or set the fill pattern (specify the fill pattern using a MsoPatternType viz. msoPattern10Percent for 10% of the foreground color, msoPatternDarkHorizontal for dark horizontal, …);
Use the Visible Property of the FillFormat object to set or return a value (msoTrue or msoFalse) which determines whether the FillFormat object is visible or not viz. objFillFormat.Visible = msoTrue indicates the FillFormat object is visible.
Setting ForeColor & BackColor for the Fill
Use the BackColor Property of the FillFormat object to set or return the background fill color when the fill is shaded or patterned – Syntax: objFillFormat.BackColor. Use the ForeColor Property of the FillFormat object to set or return the foreground fill color or in case of a solid fill just the fill color – Syntax: objFillFormat.ForeColor.
Using the BackColor Property or ForeColor Property sets or returns a ColorFormat object that represents the specified background fill or foreground fill / solid color. With this you can set a solid fill color, the foreground / background color for a gradient or patterned fill or the pointer color by using the RGB property (explicit Red-Green-Blue value) or using the SchemeColor property (an integer value representing a color in the color scheme).
To set the color to Yellow using the RGB property:
Sheets(“Sheet1”).ChartObjects(1).Chart.PlotArea.Format.Fill.ForeColor.RGB = RGB(255, 255, 0)
To set the color to Yellow using the SchemeColor property:
Sheets(“Sheet1”).ChartObjects(1).Chart.PlotArea.Format.Fill.ForeColor.SchemeColor = 13
Use the Solid Method of the FillFormat object to set a solid fill of uniform color – Syntax: objFillFormat.Solid.
Use the Transparency Property of the FillFormat object to set or return the degree of the transparency in a fill, as a value from 0.0 (opaque) to 1.0 (clear), for solid color fills (or lines) only and not for gradient, patterned, textured or picture fills (or lines). Syntax: objFillFormat.Transparency.
|
|
|
Sub PlAreaFill_Solid()
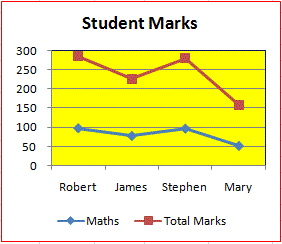
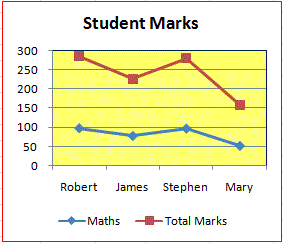
‘set a solid fill- refer Images 1a & 1b
‘set a solid fill of uniform color for the Plot Area Fill, ie. FillFormat object
With Sheets(“Sheet1”).ChartObjects(1).Chart.PlotArea.Format.Fill
‘remove fill color from Plot Area
.Visible = False
‘add fill color to Plot Area
.Visible = True
‘set a solid fill of uniform color – note that this is the Default & excluding this will not matter (use the Solid method to convert a gradient, textured, patterned or background fill back to a solid fill)
.Solid
‘set the interior color for the plot area to Yellow – refer Image 1a
.ForeColor.RGB = RGB(255, 255, 0)
‘set the degree of the transparency in a fill, as a value from 0.0 (opaque) to 1.0 (clear) – this property only affects solid color fills (or lines) and not gradient, patterned, textured or picture fills – refer Image 1b
.Transparency = 0.45
End With
End Sub
Setting Gradient Type for the Fill
Use the OneColorGradient Method of the FillFormat object to set a one-color gradient for the specified fill. Syntax: objFillFormat.OneColorGradient(Style, Variant, Degree). All 3 arguments are necessary to specify. The Style argument specifies the gradient fill style as per the MsoGradientStyle Enumeration. The Variant argument specifies the gradient variant (ie. shade variant), as an integer value from 1 to 4 which corresponds to one of the four gradients (the gradient variants numbered from left to right & from top to bottom) on the Gradient tab in the Fill Effects dialog box. The Degree argument specifies the gradient degree, which is a darkness value ranging from from 0.0 (dark) to 1.0 (light).
|
|
|
|
|
|
Sub PlArea_OneColorGradient()
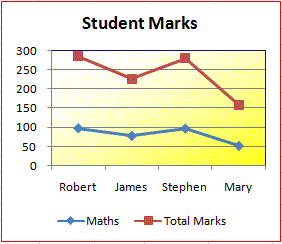
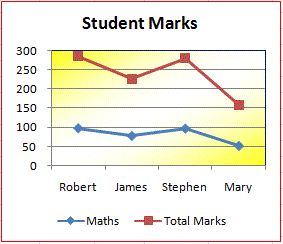
‘set a one-color gradient – refer Images 2a to 2d
‘set a one-color gradient for the Plot Area Fill, ie. FillFormat object
With Sheets(“Sheet1”).ChartObjects(1).Chart.PlotArea.Format.Fill
‘gradient fill style of msoGradientDiagonalUp and gradient variant of 1 & gradient degree of 1 (lightest)
.OneColorGradient msoGradientDiagonalUp, 1, 1
‘set the interior color for the plot area to Yellow – for gradient stop #1 (ForeColor) – refer Image 2a
.ForeColor.RGB = RGB(255, 255, 0)
‘change gradient variant to 2 – refer Image 2b
.OneColorGradient msoGradientDiagonalUp, 2, 1
‘change gradient variant to 3 – refer Image 2c
.OneColorGradient msoGradientDiagonalUp, 3, 1
‘change gradient variant to 4 – refer Image 2d
.OneColorGradient msoGradientDiagonalUp, 4, 1
End With
End Sub
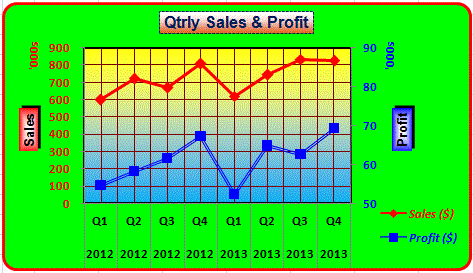
Use the TwoColorGradient Method of the FillFormat object to set a two-color gradient for the specified fill. Syntax: objFillFormat.TwoColorGradient(Style, Variant). Both arguments are necessary to specify. The Style argument specifies the gradient fill style (ie. gradient direction) as per the MsoGradientStyle Enumeration. The Variant argument specifies the gradient variant (ie. shade variant), as an integer value from 1 to 4 which corresponds to one of the four gradients (the gradient variants numbered from left to right & from top to bottom) on the Gradient tab in the Fill Effects dialog box. If the Style argument specifies msoGradientFromCenter, the Variant argument value can only be 1 or 2.
Sub PlArea_TwoColorGradient_1()
‘set a two-color gradient – refer Image 3a
‘set a two-color gradient for the Plot Area Fill, ie. FillFormat object
With Sheets(“Sheet1”).ChartObjects(1).Chart.PlotArea.Format.Fill
‘remove fill color from Plot Area
.Visible = msoFalse
‘add fill color to Plot Area
.Visible = msoTrue
‘gradient fill style of msoGradientHorizontal and gradient variant of 1
.TwoColorGradient msoGradientHorizontal, 1
‘set the interior color for stop #1 (ForeColor) to Yellow
.ForeColor.RGB = RGB(255, 255, 0)
‘set the color for stop #2 (BackColor) to Blue
.BackColor.RGB = RGB(0, 176, 240)
End With
End Sub
Sub PlArea_TwoColorGradient_2()
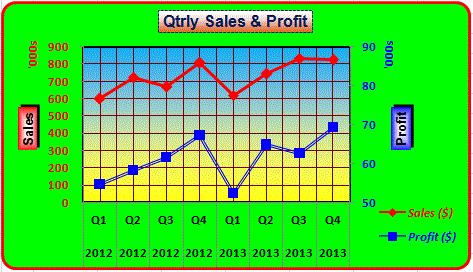
‘set a two-color gradient – refer Image 3b
‘set a two-color gradient for the Plot Area Fill, ie. FillFormat object
With Sheets(“Sheet1”).ChartObjects(1).Chart.PlotArea.Format.Fill
‘remove fill color from Plot Area
.Visible = msoFalse
‘add fill color to Plot Area
.Visible = msoTrue
‘gradient fill style of msoGradientHorizontal and gradient variant of 2
.TwoColorGradient msoGradientHorizontal, 2
‘set the interior color for stop #1 (ForeColor) to Yellow
.ForeColor.RGB = RGB(255, 255, 0)
‘set the color for stop #2 (BackColor) to Blue
.BackColor.RGB = RGB(0, 176, 240)
End With
End Sub
Use the PresetGradient Method of the FillFormat object to set a preset gradient for the specified fill. Syntax: objFillFormat.PresetGradient(Style, Variant, PresetGradientType). All 3 arguments are necessary to specify. The Style argument specifies the gradient fill style as per the MsoGradientStyle Enumeration. The Variant argument specifies the gradient variant (ie. shade variant), as an integer value from 1 to 4 which corresponds to one of the four gradients (the gradient variants numbered from left to right & from top to bottom) on the Gradient tab in the Fill Effects dialog box. The PresetGradientType argument specifies the preset gradient type defined per the MsoPresetGradientType Enumeration (ex. msoGradientBrass, msoGradientCalmWater, msoGradientDesert, msoGradientEarlySunset, msoGradientFire, msoGradientFog, msoGradientGold, msoGradientLateSunset, msoGradientOcean, etc).
MsoGradientStyle Enumeration: Name (Value – Description): msoGradientHorizontal (1 – Gradient running horizontally across the shape); msoGradientVertical (2 – Gradient running vertically down the shape); msoGradientDiagonalUp (3 – Diagonal gradient moving from a bottom corner up to the opposite corner); msoGradientDiagonalDown (4 – Diagonal gradient moving from a top corner down to the opposite corner); msoGradientFromCorner (5 – Gradient running from a corner to the other three corners); msoGradientFromTitle (6 – Gradient running from the title outward); msoGradientFromCenter (7 – Gradient running from the center out to the corners); msoGradientMixed (-2 – Gradient is mixed).
Return Gradients for the Fill:
Use the GradientColorType Property of the FillFormat object (read-only) to return the color type of gradient used for a specific fill – Syntax: objFillFormat.GradientColorType. The type of gradient returned is specified in the MsoGradientColorType Enumeration: msoGradientOneColor (value 1) – OneColorGradient; msoGradientTwoColors (value 2) – TwoColorGradient; msoGradientPresetColors (value 3) – PresetGradient defined per the MsoPresetGradientType Enumeration; msoGradientColorMixed (value -2) – is only a return value indicating a mixed gradient which is a combination of other types in the specified range.
Use the GradientDegree Property of the FillFormat object (read-only) to return the gradient degree of a OneColorGradient fill – return value is a darkness value ranging from from 0.0 (dark) to 1.0 (light). Syntax: objFillFormat.GradientDegree.
Use the GradientStyle Property of the FillFormat object (read-only) to return the gradient style of a fill – return value is as defined per the MsoGradientStyle Enumeration (msoGradientHorizontal, …). Syntax: objFillFormat.GradientStyle.
Use the GradientVariant Property of the FillFormat object (read-only) to return the the shade variant of a OneColorGradient or a TwoColorGradient fill – return value is an integer value from 1 to 4 which corresponds to one of the four gradients (the gradient variants numbered from left to right & from top to bottom) on the Gradient tab in the Fill Effects dialog box. Syntax: objFillFormat.GradientVariant.
Use the PresetGradientType Property of the FillFormat object (read-only) to return the preset gradient type of a fill – return value is as defined per the MsoPresetGradientType Enumeration (ex. msoGradientBrass, msoGradientCalmWater, …). Syntax: objFillFormat.PresetGradientType.
Gradient Stops – the End Points of Color Sections in a Gradient Fill
Use the GradientStops Property of the FillFormat object to return a GradientStops Object which refers to a collection of GradientStop objects. A gradient is a gradual transition from one color to another and the endpoint of each color section is referred to as a stop. For a Gradient Fill, Gradients are a smooth transition from one color state to another. The endpoints of these sections are called stops. Use the Item Property of the GradientStops object to return a GradientStop object – Syntax: objGradientStops.Item(Index), where index is the index number or name. The Insert Method of the GradientStops object adds a stop for the gradient. Syntax: objGradientStops.Insert(RGB, Position, Transparency, Index). The RGB & Position arguments are necessary to specify. The RGB argument is used to specify the color at the gradient stop. The Position argument is used to specify, as a percent, the stop position within the gradient. The Transparency argument is used to specify color opacity (as a percent) at the gradient stop and the Index argument is used to specify the stop index number. Use the Count Property of the GradientStops object (Syntax: objGradientStops.Count) to return the number of items (GradientStop objects) in the collection.
A single gradient stop is referred to as the GradientStop Object. Use the Position Property of the GradientStop Object to set or return the position of a gradient stop, expressed as a percent – Syntax: objGradientStop.Position. Use the Transparency Property of the GradientStop Object to set or return the color opacity (as a percent) at the gradient stop – Syntax: objGradientStop.Transparency. Use the Color Property of the GradientStop Object to return (ColorIndex number) the color of the gradient stop – Syntax: objGradientStop.Color.
The first two stops in a gradient ie. stop #1 & stop #2, are ForeColor & BackColor and additional stops, if any, will be added to the collection sequentially after these. Also note that the first and last colors in the gradient sequence are ForeColor & BackColor. A one colour gradient is actually a two colour gradient, stop #1 & stop #2 are ForeColor & BackColor.
Sub PlArea_GradientStops_1()
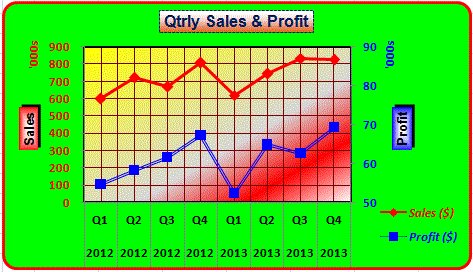
‘GradientStop, a stop for the gradient – endpoint of each color section
‘refer Image 4a
‘the first two stops ie. stop #1 & stop #2 are ForeColor & BackColor
‘additional stops, if any, will be added to the collection sequentially after these
‘the first and last colors in the gradient sequence are ForeColor & BackColor
‘set a one-color gradient for the Plot Area Fill
With Sheets(“Sheet1”).ChartObjects(1).Chart.PlotArea.Format.Fill
‘gradient fill style of msoGradientDiagonalUp and gradient variant of 1 & gradient degree of 1 (lightest)
.OneColorGradient msoGradientDiagonalUp, 1, 1
‘set the interior color for stop #1 (ForeColor) to Yellow
.ForeColor.RGB = RGB(255, 255, 0)
‘the BackColor is stop #2, its position is 1 (100%), color is white
‘insert stop #3 & set its color to grey & position to 60%
.GradientStops.Insert RGB(216, 216, 216), 0.6
‘insert stop #4 & set its color to red & position to 80%
.GradientStops.Insert RGB(255, 0, 0), 0.8
‘—————————–
‘RETURN VALUES
‘returns 0
MsgBox “Stop #1 position: ” & .GradientStops(1).Position
‘returns ColorIndex 65535 (yellow)
MsgBox “Stop #1 ColorIndex: ” & .GradientStops(1).Color
‘returns 1 – reference to BackColor
MsgBox “Stop #2 position: ” & .GradientStops(2).Position
‘returns ColorIndex 1677215 (white)
MsgBox “Stop #2 ColorIndex: ” & .GradientStops(2).Color
‘returns 0.6
MsgBox “Stop #3 position: ” & .GradientStops(3).Position
‘returns ColorIndex 14211288 (grey)
MsgBox “Stop #3 ColorIndex: ” & .GradientStops(3).Color
‘returns 0.8
MsgBox “Stop #4 position: ” & .GradientStops(4).Position
‘returns ColorIndex 255 (red)
MsgBox “Stop #4 ColorIndex: ” & .GradientStops(4).Color
‘returns 4
MsgBox “No of Gradient Stops: ” & .GradientStops.count
End With
End Sub

Sub PlArea_GradientStops_2()
‘GradientStop, a stop for the gradient – endpoint of each color section
‘refer Image 4b
‘the first two stops ie. stop #1 & stop #2 are ForeColor & BackColor
‘additional stops, if any, will be added to the collection sequentially after these
‘the first and last colors in the gradient sequence are ForeColor & BackColor
‘set a one-color gradient for the Plot Area Fill
With Sheets(“Sheet1”).ChartObjects(1).Chart.PlotArea.Format.Fill
‘gradient fill style of msoGradientDiagonalUp and gradient variant of 1 & gradient degree of 1 (lightest)
.OneColorGradient msoGradientDiagonalUp, 1, 1
‘set the interior color for stop #1 (ForeColor) to Yellow
.ForeColor.RGB = RGB(255, 255, 0)
‘set/change the color for stop #2 (BackColor) to blue
.BackColor.RGB = RGB(0, 176, 240)
‘set/change the position for BackColor (stop #2) to 40% – default position is 100% (last color in the gradient sequence)
.GradientStops(2).Position = 0.4
‘insert stop #3 & set its color to grey & position to 60%
.GradientStops.Insert RGB(216, 216, 216), 0.6
‘insert stop #4 & set its color to red & position to 80%
.GradientStops.Insert RGB(255, 0, 0), 0.8
‘—————————–
‘RETURN VALUES
‘returns 0
MsgBox “Stop #1 position: ” & .GradientStops(1).Position
‘returns ColorIndex 65535 (yellow)
MsgBox “Stop #1 ColorIndex: ” & .GradientStops(1).Color
‘returns 0.4
MsgBox “Stop #2 position: ” & .GradientStops(2).Position
‘returns ColorIndex 15773696 (blue)
MsgBox “Stop #2 ColorIndex: ” & .GradientStops(2).Color
‘returns 0.6
MsgBox “Stop #3 position: ” & .GradientStops(3).Position
‘returns ColorIndex 14211288 (grey)
MsgBox “Stop #3 ColorIndex: ” & .GradientStops(3).Color
‘returns 0.8
MsgBox “Stop #4 position: ” & .GradientStops(4).Position
‘returns ColorIndex 255 (red)
MsgBox “Stop #4 ColorIndex: ” & .GradientStops(4).Color
‘returns 4
MsgBox “No of Gradient Stops: ” & .GradientStops.count
End With
End Sub
Use the Patterned Method of the FillFormat object to set a defined pattern to the specified fill – Syntax: objFillFormat.Patterned(Pattern). The Pattern argument is necessary to specify the type of pattern defined as per the MsoPatternType Enumeration viz. msoPattern5Percent (value 1 – 5% of the foreground color); msoPattern10Percent; msoPattern20Percent; … msoPattern90Percent (value 12 – 90% of the foreground color); msoPatternCross (value 51 – Cross); msoPatternDarkDownwardDiagonal (value 15 – Dark Downward Diagonal); msoPatternDarkHorizontal (value 13 – Dark Horizontal); msoPatternDashedHorizontal (value 32 – Dashed Horizontal); msoPatternDiagonalBrick (value 40 – Diagonal Brick); msoPatternDottedGrid (value 45 – Dotted Grid); msoPatternLightVertical (value 20 – Light Vertical); etc.
You can also use the Pattern Property of the FillFormat object (Syntax: objFillFormat.Pattern) to set or return a fill pattern defined as per the MsoPatternType Enumeration.
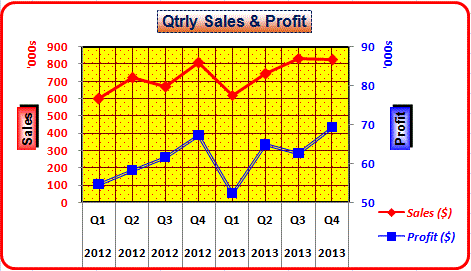
Sub PlArea_Pattern_1()
‘set a defined pattern for the specified fill – refer Image 5a
‘fill white color for Chart Area
Sheets(“Sheet1”).ChartObjects(1).Chart.ChartArea.Format.Fill.ForeColor.RGB = RGB(255, 255, 255)
‘for the Plot Area Fill, ie. FillFormat object
With Sheets(“Sheet1”).ChartObjects(1).Chart.PlotArea.Format.Fill
‘specify fill pattern for Plot Area to msoPattern90Percent (90% of the foreground color)
.Patterned msoPattern90Percent
‘set fore color for the plot area to Yellow
.ForeColor.RGB = RGB(255, 255, 0)
‘set back color for the plot area to red
.BackColor.RGB = RGB(255, 0, 0)
‘returns the fill pattern, value 12, corresponding to msoPattern90Percent
MsgBox .Pattern
‘get the fill type – returns value 2 representing a Patterned fill (msoFillPatterned)
MsgBox .Type
End With
End Sub
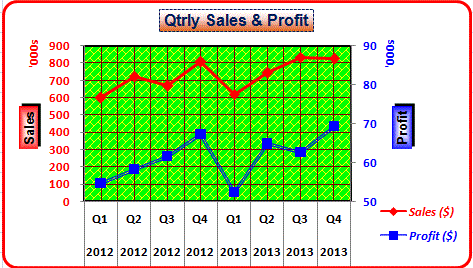
Sub PlArea_Pattern_2()
‘set a defined pattern for the specified fill – refer Image 5b
‘fill white color for Chart Area
Sheets(“Sheet1”).ChartObjects(1).Chart.ChartArea.Format.Fill.ForeColor.RGB = RGB(255, 255, 255)
‘for the Plot Area Fill, ie. FillFormat object
With Sheets(“Sheet1”).ChartObjects(1).Chart.PlotArea.Format.Fill
‘specify fill pattern for Plot Area to msoPatternDiagonalBrick (Diagonal Brick)
.Patterned msoPatternDiagonalBrick
‘set fore color for the plot area to Yellow
.ForeColor.RGB = RGB(255, 255, 0)
‘set back color for the plot area to green – refer Image 8b
.BackColor.RGB = RGB(0, 255, 0)
‘returns the fill pattern, value 40, corresponding to msoPatternDiagonalBrick
MsgBox .Pattern
‘get the fill type – returns value 2 representing a Patterned fill (msoFillPatterned)
MsgBox .Type
End With
End Sub
Use the PresetTextured Method of the FillFormat object to set a preset texture to the specified fill – Syntax: objFillFormat.PresetTextured(PresetTexture). The PresetTexture argument is necessary to specify the type of texture defined as per the MsoPresetTexture Enumeration viz. msoTextureCanvas (value 2) – Canvas Texture; msoTextureDenim (value 3) – Denim Texture; msoTextureWaterDroplets (value 5) – Water Droplets Texture; msoTextureSand (value 8) – Sand Texture; msoTextureWhiteMarble (value 10) – White Marble Texture; msoTextureCork (value 21) – Cork Texture; msoTextureWalnut (value 22) – Walnut Texture; etc. Use the PresetTexture Property of the FillFormat object (read-only) to return the preset texture of a fill – return value is as defined per the MsoPresetTexture Enumeration – Syntax: objFillFormat.PresetTexture.
Sub PlArea_PresetTextured()
‘set a preset texture to the specified fill
‘for the Plot Area Fill, ie. FillFormat object
With Sheets(“Sheet1”).ChartObjects(1).Chart.PlotArea.Format.Fill
‘specify fill preset texture for Plot Area to msoTextureSand – Sand Texture
.PresetTextured msoTextureSand
‘get the fill type – returns value 4 representing a Textured fill (msoFillTextured)
MsgBox .Type
End With
End Sub
Use the UserTextured Method of the FillFormat object to set small tiles of an image to the specified fill – Syntax: objFillFormat.UserTextured(TextureFile). The TextureFile argument is necessary and it is a string value specifying the picture file name. Use the UserPicture Method to set a single image to the specified fill.
Sub PlArea_UserTextured()
‘use the UserTextured Method of the FillFormat object to set small tiles of an image to the specified fill
‘for the Plot Area Fill, ie. FillFormat object
With Sheets(“Sheet1”).ChartObjects(1).Chart.PlotArea.Format.Fill
‘set small tiles of an image to the specified fill
.UserTextured “C:\Users\Amit Tandon\Documents\Photos\IMG_2032.JPG”
End With
End Sub
Use the TextureType Property of the FillFormat object (read-only) to return the texture type of a fill. Return value is as defined per the MsoTextureType Enumeration: msoTexturePreset (value 1) – Preset Texture Type; msoTextureUserDefined (value 2) – User-defined Texture Type; msoTextureTypeMixed (value -2) – is only a return value indicating a mixed texture which is a combination of other types. Syntax: objFillFormat.TextureType.
Setting Picture (Single Image) for the Fill
Use the UserPicture Method of the FillFormat object to set an image to the specified fill – Syntax: objFillFormat.UserPicture(PictureFile). The PictureFile argument is necessary and it is a string value specifying the picture file name. To set small tiles of an image to the specified fill, use the UserTextured Method.
Sub PlArea_UserPicture()
‘use the UserPicture Method of the FillFormat object to set an image to the specified fill
‘for the Plot Area Fill, ie. FillFormat object
With Sheets(“Sheet1”).ChartObjects(1).Chart.PlotArea.Format.Fill
‘set an image to the specified fill
.UserPicture “C:\Users\Amit Tandon\Documents\Photos\IMG_2032.JPG”
‘get the Texture type – returns value 2 representing a User-defined Texture Type (msoTextureUserDefined)
MsgBox .TextureType
‘get the fill type – returns value 6 representing a Picture Fill (msoFillPicture)
MsgBox .Type
End With
End Sub
Use the Type Property of the FillFormat object to return the fill type as per values defined in the MsoFillType Enumeration, which are: msoFillSolid (value 1) – Solid Fill; msoFillPatterned (value 2) – Patterned Fill; msoFillGradient (value 3) – Gradient Fill; msoFillTextured (value 4) – Textured Fill; msoFillBackground (value 5) – Same Fill as the Background (not used in Excel); msoFillPicture (value 6) – Picture Fill; msoFillMixed (value -2) – Mixed Fill. Return values could also return xlAutomatic or xlNone. Syntax: objFillFormat.Type.
The Line Property of the ChartFormat object (Syntax: objChartFormat.Line) returns a LineFormat object for the parent chart element, and this LineFormat object, which can be a Line itself or a border (where the chart has a border), contains line & arrowhead formatting properties for that chart element. Some of these properties are: LineFormat.BackColor Property – to return or set the fill background color; LineFormat.ForeColor Property – to return or set the foreground fill or solid color; LineFormat.Style Property – to return or set the line style (MsoLineStyle value which can be msoLineSingle for a single line, msoLineThinThin for 2 thin lines, …); LineFormat.Weight Property – to return or set the line weight; and so on.
Use the Visible Property of the LineFormat object to set or return a value (msoTrue or msoFalse) which determines whether the LineFormat object is visible or not viz. objLineFormat.Visible = msoTrue indicates the LineFormat object is visible.
Setting ForeColor & BackColor for the Line Fill
Use the BackColor Property of the LineFormat object to set or return the background fill color when the fill is shaded or patterned – Syntax: objLineFormat.BackColor. Use the ForeColor Property of the LineFormat object to set or return the foreground fill color or in case of a solid fill just the fill color – Syntax: objLineFormat.ForeColor. Also refer ‘Setting ForeColor & BackColor for the FillFormat object’.
Setting Style or Dash Style for a Line
Use the Style Property of the LineFormat object (Syntax: objLineFormat.Style) to set or return the style for the specified line, as per the style constants defined in the MsoLineStyle Enumeration viz. msoLineSingle (value 1) – single line; msoLineThinThin (value 2) – two thin lines; msoLineThinThick (value 3) – thick line next to thin line (thick line is below thin line for horizontal lines and thick line is to the right of the thin line for vertical lines); msoLineThickThin (value 4) – thick line next to thin line (thick line is above thin line for horizontal lines and thick line is to the left of the thin line for vertical lines); msoLineThickBetweenThin (value 5) – thick line between two thin lines; msoLineStyleMixed (value -2) – not supported;
Use the DashStyle Property of the LineFormat object (Syntax: objLineFormat.DashStyle) to set or return the dash style for the specified line, as per the dash style constants defined in the MsoLineDashStyle Enumeration viz. msoLineSolid (value 1) – solid line; msoLineSquareDot (value 2) – square dots; msoLineRoundDot (value 3) – round dots; msoLineDash (value 4) – dashes only; msoLineDashDot (value 5) – dash-dot pattern; msoLineDashDotDot (value 6) – dash-dot-dot pattern; msoLineLongDash (value 7) – long dashes; msoLineLongDashDot (value 8) – long dash-dot pattern; msoLineDashStyleMixed (value -2) – not supported;
Setting Pattern for the Line Fill
Use the Pattern Property of the LineFormat object (Syntax: objLineFormat.Pattern) to set or return the fill pattern for the specified line, as per the type of pattern defined in the MsoPatternType Enumeration viz. msoPattern5Percent (value 1 – 5% of the foreground color); msoPattern10Percent; msoPattern20Percent; … msoPattern90Percent (value 12 – 90% of the foreground color); msoPatternCross (value 51 – Cross); msoPatternDarkDownwardDiagonal (value 15 – Dark Downward Diagonal); msoPatternDarkHorizontal (value 13 – Dark Horizontal); msoPatternDashedHorizontal (value 32 – Dashed Horizontal); msoPatternDiagonalBrick (value 40 – Diagonal Brick); msoPatternDottedGrid (value 45 – Dotted Grid); msoPatternLightVertical (value 20 – Light Vertical); etc.
Use the below Properties of the LineFormat object to set or return the arrowhead length, width & style at the beginning or end of the specified line, as per constants defined in the respective Enumeration viz. MsoArrowheadLength, MsoArrowheadWidth & MsoArrowheadStyle.
| Property | Syntax | Description |
| BeginArrowheadLength Property | objLineFormat.BeginArrowheadLength | set or return the arrowhead length at the beginning of a line |
| EndArrowheadLength Property | objLineFormat.EndArrowheadLength | set or return the arrowhead length at the end of a line |
| Enumeration: MsoArrowheadLength (Constant – Value – Description) | ||
| msoArrowheadShort | 1 | Short |
| msoArrowheadLengthMedium | 2 | Medium |
| msoArrowheadLong | 3 | Long |
| msoArrowheadLengthMixed | -2 | is only a return value – indicates a combination of the other states |
| BeginArrowheadWidth Property | objLineFormat.BeginArrowheadWidth | set or return the arrowhead width at the beginning of a line |
| EndArrowheadWidth Property | objLineFormat.EndArrowheadWidth | set or return the arrowhead width at the end of a line |
| Enumeration: MsoArrowheadWidth (Constant – Value – Description) | ||
| msoArrowheadNarrow | 1 | Narrow |
| msoArrowheadWidthMedium | 2 | Medium |
| msoArrowheadWide | 3 | Wide |
| msoArrowheadWidthMixed | -2 | is only a return value – indicates a combination of the other states |
| BeginArrowheadStyle Property | objLineFormat.BeginArrowheadStyle | set or return the arrowhead style at the beginning of a line |
| EndArrowheadStyle Property | objLineFormat.EndArrowheadStyle | set or return the arrowhead style at the end of a line |
| Enumeration: MsoArrowheadStyle (Constant – Value – Description) | ||
| msoArrowheadNone | 1 | No arrowhead |
| msoArrowheadTriangle | 2 | Triangular |
| msoArrowheadOpen | 3 | Open |
| msoArrowheadStealth | 4 | Stealth shaped |
| msoArrowheadDiamond | 5 | Diamond shaped |
| msoArrowheadOval | 6 | Oval shaped |
| msoArrowheadStyleMixed | -2 | is only a return value – indicates a combination of the other states |
Example: Set arrowheads at the beginning & end of the series line – refer Image 6
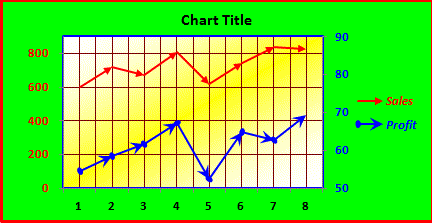
Sub Chart_LineFormat_Arrowheads()
‘set arrowheads at the beginning & end of the series line – refer Image 6
With Sheets(“Sheet1”).ChartObjects(1).Chart
With .SeriesCollection(1)
‘no markers for series 1
.MarkerStyle = xlMarkerStyleNone
‘use the Format Property of the Series object to return the ChartFormat object – using the Line Property of the ChartFormat object returns a LineFormat object that contains line formatting properties
With .Format.Line
‘switching the line visibility off & on seems necessary to set the line colour using the ForeColor Property of the LineFormat object (in Excel 2007)
.Visible = msoFalse
.Visible = msoTrue
‘sets Series Line width to 1.5 pts
.Weight = 1.5
‘set the foreground fill color for Series Line to red
.ForeColor.RGB = RGB(255, 0, 0)
‘using the BeginArrowheadStyle Property the LineFormat object, set No arrowhead at the beginning of the series line
.BeginArrowheadStyle = msoArrowheadNone
‘using the EndArrowheadStyle Property the LineFormat object, set the arrowhead style at the end of the series line to Triangular
.EndArrowheadStyle = msoArrowheadTriangle
‘using the EndArrowheadWidth Property the LineFormat object, set the arrowhead width at the end of the series line to medium
.EndArrowheadWidth = msoArrowheadWidthMedium
‘using the EndArrowheadLength Property the LineFormat object, set the arrowhead length at the end of the series line to medium
.EndArrowheadLength = msoArrowheadLengthMedium
End With
End With
With .SeriesCollection(2)
‘no markers for series 2
.MarkerStyle = xlMarkerStyleNone
With .Format.Line
.Visible = msoFalse
.Visible = msoTrue
‘set Series Line width to 1.25 pt
.Weight = 1.25
‘set the foreground fill color for Series Line to blue
.ForeColor.RGB = RGB(0, 0, 255)
‘using the BeginArrowheadStyle Property the LineFormat object, set the arrowhead style at the beginning of the series line to Oval shaped
.BeginArrowheadStyle = msoArrowheadOval
‘using the BeginArrowheadWidth Property the LineFormat object, set the arrowhead width at the beginning of the series line to medium
.BeginArrowheadWidth = msoArrowheadWidthMedium
‘using the BeginArrowheadLength Property the LineFormat object, set the arrowhead length at the beginning of the series line to short
.BeginArrowheadLength = msoArrowheadShort
‘set the arrowhead style at the end of the series line to Stealth shaped
.EndArrowheadStyle = msoArrowheadStealth
‘set the arrowhead width at the end of the series line to wide
.EndArrowheadWidth = msoArrowheadWide
‘set the arrowhead length at the end of the series line to long
.EndArrowheadLength = msoArrowheadLong
End With
End With
End With
End Sub
Transparency & Weight Properties of the LineFormat object
Use the Transparency Property of the LineFormat object to set or return the degree of the transparency in a fill, as a value from 0.0 (opaque) to 1.0 (clear), for solid color lines (or fills) only and not for gradient, patterned, textured or picture lines (or fills). Syntax: objLineFormat.Transparency. Use the Weight Property of the LineFormat object to set or return the weight of a line in points – Syntax: objLineFormat.Weight.
Example: Illustrates formatting for Chart Series Lines & Chart Area Border – refer Image 7
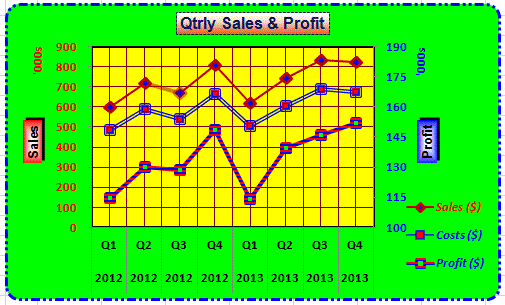
Sub LineFormat_ChSeries_ChArea()
‘LineFormat object, which can be a Line itself or a border (where the chart has a border), contains line formatting properties for the parent chart element – this example illustrates formatting for Chart Series lines & Chart Area border – refer Image 7
Dim wsChart As Worksheet
‘declare a ChartObject object
Dim oChObj As ChartObject
Set wsChart = Sheets(“Sheet8”)
‘set ChartObject object by index number
Set oChObj = wsChart.ChartObjects(1)
‘—————————-
‘SERIES 1 – LINE FORMATTING
‘using the Chart Property of the ChartObject object returns a Chart object which refers to a chart
‘for series 1: set blue inside color (ie. fill color) for marker (ColorIndex 3 for red, 5 for blue, 4 for green, 6 for yellow, …)
oChObj.Chart.SeriesCollection(1).MarkerBackgroundColorIndex = 5
‘LineFormat object of series 1 – using the Line Property of the ChartFormat object, returns a LineFormat object that contains line formatting properties
With oChObj.Chart.SeriesCollection(1).Format.Line
‘switch the line visibility off & on
.Visible = msoFalse
.Visible = msoTrue
‘set solid line
.DashStyle = msoLineSolid
‘using the Style Property of the LineFormat object to set the style for the line (using a MsoLineStyle value)
.Style = msoLineSingle
‘using the Weight Property of the LineFormat object to set the weight for the line
‘sets both Series Line width AND Marker Border Line width to 2.5 pt
.Weight = 2.5
‘set the Series Line color AND the Marker Border Line color, to dark red
.ForeColor.RGB = RGB(192, 0, 0)
End With
‘for series 1:
With oChObj.Chart.SeriesCollection(1)
‘use the Weight Property of the Border object to set the border weight (using a XlBorderWeight enumeration value)
‘reapply series line thickness only – sets series line width to 2 pts
.Border.Weight = xlMedium
‘use the Points Method of the Series object to return a single point (Point object) – point no 3
With .Points(3)
‘this sets the Marker weight (marker’s border line width) & color and also sets the series line thickness & color for point no 2 to point no 3
.Format.Line.Weight = 3
‘set the degree of the transparency, as a value from 0.0 (opaque) to 1.0 (clear), for solid color lines
.Format.Line.Transparency = 0.5
End With
End With
‘—————————-
‘SERIES 2 – LINE FORMATTING
‘for series 2: set red inside color (ie. fill color) for marker
oChObj.Chart.SeriesCollection(2).MarkerBackgroundColorIndex = 3
‘LineFormat object of series 2
With oChObj.Chart.SeriesCollection(2).Format.Line
.Visible = msoFalse
.Visible = msoTrue
‘using the Style Property of the LineFormat object to set the style for the line (using a MsoLineStyle value) to two thin lines
.Style = msoLineThinThin
‘using the DashStyle Property of the LineFormat object to set the dash style for the line (using a MsoLineDashStyle value) to solid line
.DashStyle = msoLineSolid
‘using the Weight Property of the LineFormat object to set the weight for the line
‘sets both Series Line width AND Marker Border Line width to 2 pt
.Weight = 3
‘set the Series Line color AND the Marker Border Line color, to blue
.ForeColor.RGB = RGB(0, 0, 255)
End With
‘—————————-
‘SERIES 3 – LINE FORMATTING
‘for series 3: set green inside color (ie. fill color) for marker
oChObj.Chart.SeriesCollection(3).MarkerBackgroundColorIndex = 4
With oChObj.Chart.SeriesCollection(3).Format.Line
.Visible = msoFalse
.Visible = msoTrue
‘single line
.Style = msoLineSingle
‘solid line
.DashStyle = msoLineSolid
‘use the Pattern Property of the LineFormat object to set the fill pattern for both Series Line AND Marker Border Line, (using a MsoPatternType value) to Dark Horizontal
.Pattern = msoPatternDarkHorizontal
‘sets both Series Line width AND Marker Border Line width to 3 pt
.Weight = 3
‘set the foreground fill color for both Series Line AND the Marker Border Line, to blue
.ForeColor.RGB = RGB(0, 0, 255)
‘set the background fill color for both Series Line AND Marker Border Line, to red
.BackColor.RGB = RGB(255, 0, 0)
End With
‘—————————-
‘CHART AREA – FORMATTING BORDER
‘using the ChartArea Property of the Chart object returns the ChartArea object which represents the chart area
‘the Format Property of the ChartArea object returns the ChartFormat object, and the Line Property of the ChartFormat object returns a LineFormat object that contains line formatting properties for the specified Chart Area – for a chart with a border, the LineFormat object represents the border
With oChObj.Chart.ChartArea.Format.Line
‘turn on the border for the chart area
.Visible = True
‘using the Weight Property of the LineFormat object, to set the weight of the border
.Weight = 2.25
‘set border to dash-dot-dot pattern line
.DashStyle = msoLineDashDotDot
‘set the foreground fill color of the border to blue
.ForeColor.RGB = RGB(0, 0, 255)
End With
End Sub
The Shadow Property of the ChartFormat Object (Syntax: objChartFormat.Shadow) returns a ShadowFormat object which represents a shadow for the parent chart element, and this ShadowFormat object contains shadow formatting properties for that chart element. Some of these properties are: ShadowFormat.ForeColor Property – to return or set the foreground fill or solid color; ShadowFormat.Style Property – to return or set the shadow style (uses MsoShadowStyle values which can be msoShadowStyleInnerShadow to specify inner shadow effect, msoShadowStyleOuterShadow to specify outer shadow effect, msoShadowStyleMixed to specify combo of inner & outer shadow effects); ShadowFormat.Type Property – to return or set the shadow format type (uses MsoShadowType values which can be msoShadow1 for first shadow type, msoShadow2 for second shadow type, …); and so on.
Use the Visible Property of the ShadowFormat object to set or return a value (msoTrue or msoFalse) which determines whether the ShadowFormat object is visible or not viz. objShadowFormat.Visible = msoTrue indicates the ShadowFormat object is visible.
Use the ForeColor Property of the ShadowFormat object to set or return the foreground fill color or in case of a solid fill just the fill color – Syntax: objShadowFormat.ForeColor.
Use the Blur Property of the ShadowFormat object to set or return a value (within a range of 0 to 100 points) indicating a shadow’s blurriness degree. Syntax: objShadowFormat.Blur.
The OffsetX Property of the ShadowFormat object sets or returns a value, in points, indicating the horizontal offset of the shadow to its parent chart element, with a positive value offsetting the shadow to the right of the chart element and a negative value offsetting the shadow to the left – Syntax: objShadowFormat.OffsetX. Use the OffsetY Property of the ShadowFormat object to set or return a value, in points, indicating the vertical offset of the shadow to its parent chart element, with a positive value offsetting the shadow below the chart element and a negative value offsetting the shadow above the chart element – Syntax: objShadowFormat.OffsetY.
The OffsetX & OffsetY Properties are used to offset the shadow using absolute values but if you want to offset the shadow relatively (horizontally or vertically) from its current position, then use the IncrementOffsetX or the IncrementOffsetY methods – Syntax: objShadowFormat.IncrementOffsetX(Increment) or objShadowFormat.IncrementOffsetX(Increment). The Increment argument is necessary, and for the IncrementOffsetX method it specifies the distance, in points, to move the shadow horizontally from its current position, with a positive value moving the shadow to the right, and a negative value moving the shadow to the left. For the IncrementOffsetY method the Increment argument specifies the distance, in points, to move the shadow vertically from its current position, with a positive value moving the shadow down, and a negative value moving the shadow up.
Use the Size Property of the ShadowFormat object to set or return a value (a Single value type representing the percentage size) for the shadow’s size. Syntax: objShadowFormat.Size.
Use the Style Property of the ShadowFormat object (Syntax: objShadowFormat.Style) to set or return the type of shadowing effect for the specified shadow, as per the style constants defined in the MsoShadowStyle Enumeration viz. msoShadowStyleInnerShadow (value 1) – inner shadow effect; msoShadowStyleOuterShadow (value 2) – outer shadow effect; msoShadowStyleMixed (value -2) – combination of inner & outer shadow effects.
Use the Type Property of the ShadowFormat object (Syntax: objShadowFormat.Type) to set or return the format type of a shadow, as per the specified constants in the MsoShadowType Enumeration viz. msoShadow1 (value 1) – First shadow type; msoShadow2 (value 2) – Second shadow type; msoShadow3 (value 3) – Third shadow type; … msoShadow20 (value 20) – Twentieth shadow type. The msoShadowType constants‘ numbering corresponds to their order (left to right, top to bottom) within the Drawing toolbar’s Shadow Style set.
Use the Transparency Property of the ShadowFormat object to set or return the degree of the transparency in a fill, as a value from 0.0 (opaque) to 1.0 (clear), for solid color fills only and not for gradient, patterned, textured or picture fills. Syntax: objShadowFormat.Transparency.
Example: Illustrates Shadow Formatting for Chart Area, Chart Title & Axis Title – refer Image 8
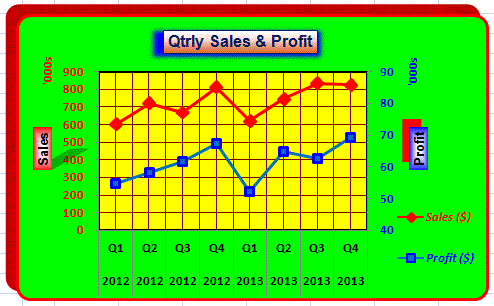
Sub ShadowFormat_ChArea_ChTitle_AxTitle()
‘shadow formatting for Chart Area, Chart Title & Axis Title – refer Image 8
Dim wsChart As Worksheet
‘declare a ChartObject object
Dim oChObj As ChartObject
Set wsChart = Sheets(“Sheet8”)
‘set ChartObject object by index number
Set oChObj = wsChart.ChartObjects(1)
‘using the Chart Property of the ChartObject object returns a Chart object which refers to a chart
With oChObj.Chart
‘—————————-
‘CHART AREA – SHADOW FORMATTING
‘using the ChartArea Property of the Chart object returns the ChartArea object which represents the chart area
With .ChartArea
‘set a Boolean value of True which determines a shadow for the ChartArea object
.Shadow = True
‘the Format Property of the ChartArea object returns the ChartFormat object, and the Shadow Property of the ChartFormat Object returns a ShadowFormat object which contains shadow formatting properties for the chart area.
With .Format.Shadow
‘use the Style Property of the ShadowFormat object to set the type of shadowing effect, as per the style constants defined in the MsoShadowStyle Enumeration
.Style = msoShadowStyleOuterShadow
‘use the ForeColor Property of the ShadowFormat object to set the fill color for the shadow
.ForeColor.RGB = RGB(192, 0, 0)
‘use the Size Property of the ShadowFormat object to set a value representing the percentage size for the shadow
.Size = 101
‘the OffsetX Property of the ShadowFormat object sets a value, in points, indicating the horizontal offset of the shadow to the chart area, with a negative value offsetting the shadow to the left
.OffsetX = -5
‘the OffsetY Property of the ShadowFormat object sets a value, in points, indicating the vertical offset of the shadow to the chart area, with a negative value offsetting the shadow to the above
.OffsetY = -6
End With
End With
‘—————————-
‘CHART TITLE – SHADOW FORMATTING
‘the ChartTitle object represents the chart title
With .ChartTitle
.Shadow = True
With .Format.Shadow
.ForeColor.RGB = RGB(0, 0, 255)
‘use the Blur Property of the ShadowFormat object to set a value, within a range of 0 to 100 points, indicating the shadow’s blurriness degree
.Blur = 5
.Size = 108
.Style = msoShadowStyleOuterShadow
End With
End With
‘—————————-
‘PRIMARY VALUE AXIS TITLE – SHADOW FORMATTING
‘refer the Axis object – Value axis in the Primary axis group
With .Axes(xlValue, xlPrimary).AxisTitle
.Shadow = True
With .Format.Shadow
‘use the Type Property of the ShadowFormat object to set the format type of a shadow, as per the specified constants in the MsoShadowType Enumeration
.Type = msoShadow4
‘the Transparency Property of the ShadowFormat object sets the degree of the transparency in a fill, as a value from 0.0 (opaque) to 1.0 (clear), for solid color fills
.Transparency = 0.7
End With
End With
‘—————————-
‘SECONDARY VALUE AXIS TITLE – SHADOW FORMATTING
‘refer the Axis object – Value axis in the Secondary axis group
With .Axes(xlValue, xlSecondary).AxisTitle
.Shadow = True
With .Format.Shadow
.ForeColor.RGB = RGB(255, 0, 0)
.Blur = 0
.Size = 100
.OffsetX = 6
.OffsetY = -5
End With
End With
End With
End Sub
The Glow Property of the ChartFormat Object (Syntax: objChartFormat.Glow) returns a GlowFormat object which represents a glow effect by adding a vibrant colored edge around the parent chart element, and this GlowFormat object contains glow formatting properties. Use the Color Property of the GlowFormat object to set or return the color of the glow – Syntax: objGlowFormat.Color. Use the Radius Property of the GlowFormat object to set or return the radius of the glow, in points (Syntax: objGlowFormat.Radius) within a range of 0 (glow not visible at 0, and being barely visible at value 1) to 20 (glow will be very thick at value 20). Glow effect can be applied in Excel from the Glow settings available in the Shape Effects dropdown under the Format tab. Refer Example 9 below.
The SoftEdge Property of the ChartFormat Object (Syntax: objChartFormat.SoftEdge) returns a SoftEdgeFormat object which represents the soft edges effect by creating a mask around and blending the chart element with the transparent edge resulting in a faded or soft edge, and this SoftEdgeFormat object contains soft edge formatting properties for the chart element. Use the Type Property of the SoftEdgeFormat object (Syntax: objSoftEdgeFormat.Type) to set or return the type of the SoftEdgeFormat object, as per the specified constants in the MsoSoftEdgeType Enumeration viz. there are six levels of soft edge settings: msoSoftEdgeType1 to msoSoftEdgeType6, as below. Soft Edge can be applied in Excel from the Soft Edges settings available in the Shape Effects dropdown under the Format tab.
| Soft Edge Type | Value | Points by which the edge is feathered |
| msoSoftEdgeTypeNone |
0 | No Soft Edge |
| msoSoftEdgeType1 | 1 | 1 Point |
| msoSoftEdgeType2 | 2 | 2.5 Points |
| msoSoftEdgeType3 | 3 | 5 Points |
| msoSoftEdgeType4 | 4 | 10 Points |
| msoSoftEdgeType5 | 5 | 25 Points |
| msoSoftEdgeType6 | 6 | 50 Points |
Example: Loop to set different soft edge types (values 1 to 6 corresponding with msoSoftEdgeType1 to msoSoftEdgeType6) for Point nos. 1 to 6 of Chart Series 1
Dim oChObj As ChartObject
Set oChObj = Sheets(“Sheet1”).ChartObjects(1)
For i = 1 To 6
oChObj.Chart.SeriesCollection(1).Points(i).Format.SoftEdge.Type = i
Next i
Example: Set Glow Effects & Soft Edges for Chart Elements – refer Image 9
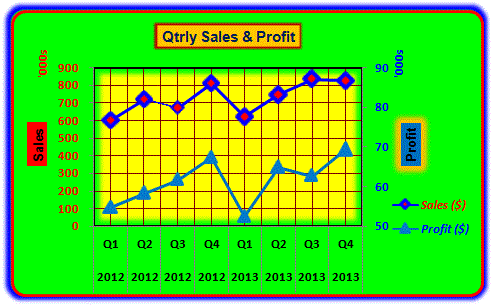
Sub GlowFormat_SoftEdge()
‘Glow Effect for Chart Area, Chart Title & Axis Title
‘Soft Edge for Plot Area & Point No. 3 of Series 1
‘refer Image 9
Dim wsChart As Worksheet
Dim oChObj As ChartObject
Set wsChart = Sheets(“Sheet8”)
Set oChObj = wsChart.ChartObjects(1)
With oChObj.Chart
‘—————————-
‘CHART AREA – GLOW EFFECT
With .ChartArea
‘green color for chart area fill
.Format.Fill.ForeColor.RGB = RGB(0, 255, 0)
‘continuous line for chart area border
.Border.LineStyle = xlContinuous
‘set red color for chart area border
.Border.ColorIndex = 3
‘set glow radius
.Format.Glow.Radius = 8
‘set glow color to blue
.Format.Glow.Color.RGB = RGB(0, 0, 255)
End With
‘—————————-
‘CHART TITLE – GLOW EFFECT
With .ChartTitle.Format
‘set glow radius
.Glow.Radius = 4
‘set glow color to dark red
.Glow.Color.RGB = RGB(192, 0, 0)
End With
‘—————————-
‘AXIS TITLE – GLOW EFFECT
With .Axes(xlValue, xlPrimary).AxisTitle.Format
‘set glow radius to 0 which means No Glow
.Glow.Radius = 0
‘setting glow color will have no effect
.Glow.Color.RGB = RGB(0, 176, 240)
End With
With .Axes(xlValue, xlSecondary).AxisTitle.Format.Glow
‘set glow radius
.Radius = 10
‘set glow color to orange
.Color.RGB = RGB(255, 192, 0)
End With
‘—————————-
‘PLOT AREA – SOFT EDGE
With .PlotArea.Format
‘set plot area fill color to yellow
.Fill.ForeColor.RGB = RGB(255, 255, 0)
‘plot area edge is feathered (ransparent edge resulting in a faded or soft edge) by 5 points
.SoftEdge.Type = msoSoftEdgeType3
End With
‘—————————-
‘POINT NO. 3 OF SERIES 1 – SOFT EDGE
With .SeriesCollection(1)
‘line thickness (including marker line thickness) of Series 1 set to 2.75 points
.Format.Line.Weight = 2.75
‘series line color (including marker line border) set to blue
.Format.Line.ForeColor.RGB = RGB(0, 0, 255)
With .Points(3)
‘point no. 3 of Series 1 is feathered (ransparent edge resulting in a faded or soft edge) by 1 point
.Format.SoftEdge.Type = msoSoftEdgeType1
End With
End With
End With
End Sub
3-D Charts: Use the ChartType Property of the Chart object to set or return the chart type. Syntax: objChart.ChartType. Refer the XlChartType Enumeration which specifies the chart type – you can create a 3-D chart or change a chart type to 3-D using one of the XlChartType constants viz. xl3DArea, xl3DAreaStacked, xl3DAreaStacked100, xl3DBarClustered, xl3DBarStacked, xl3DBarStacked100, xl3DColumn, xl3DColumnClustered, xl3DColumnStacked, xl3DColumnStacked100, xl3DLine, xl3DPie, xl3DPieExploded. There is a depth (series) axis, also known as the z axis, in 3-D column, 3-D cone or 3-D pyramid charts. Axis Type: XlAxisType Enumeration specifies the Axis Type – For 2-D charts, xlCategory returns the x-axis and xlValue returns the y-axis. For 3-D charts, xlSeries returns the z-axis (or depth of the chart). Axis Group: XlAxisGroup Enumeration specifies the Axis Group – For 2-D charts, xlPrimary returns primary axis (default axis), xlSecondary returns secondary axis. 3-D charts cannot have secondary axis. 3-D charts do not accommodate combination charts (charts with added series) so that Secondary axes are not supported in 3-D charts.
3-D settings: To manipulate 3-D settings, you will primarily use the ThreeDFormat object which represents the three-dimensional formatting of the parent chart element. The Methods & Properties of the ThreeDFormat object will enable you to manipulate 3-D settings available in Excel in the Shape Effects dropdown under the Format tab or in the 3-D Format & 3-D Rotation categories of the Format Shape dialog.
The ThreeD Property of the ChartFormat Object (Syntax: objChartFormat.ThreeD) returns a ThreeDFormat object which represents the three-dimensional formatting of the parent chart element, and this ThreeDFormat object contains 3-D effect formatting properties for that chart element. 3-D formatting can be applied in Excel from the three settings of Preset, Bevel & 3-D Rotation available in the Shape Effects dropdown under the Format tab, and these 3 settings are accessed through the ThreeDFormat object in vba.
Use the Visible Property of the ThreeDFormat object to set or return a value (msoTrue or msoFalse) which determines whether the ThreeDFormat object is visible or not viz. objThreeDFormat.Visible = msoTrue indicates the ThreeDFormat object is visible.
Use the below Properties of the ThreeDFormat object, using the specified value type or the constants defined in the respective Enumeration. Some of these properties can be used only in 3-D charts. Note that three-dimensional formatting cannot be applied to shapes like beveled shapes or multiple-disjoint paths for which most properties and methods of the ThreeDFormat object will not be valid.
Bevel effect:
To the Top or Bottom border of a shape, you can apply a bevel which is a 3-D edge effect that gives an appearance of a raised edge by adding shadows & highlights to the shape’s edges. In Excel, 12 types of bevel can be applied from the Bevel presets available in the Shape Effects dropdown under the Format tab or in the 3-D Format category of the Format Shape dialog. In vba, you will use the BevelTopType Property (or the BevelBottomType Property) of the ThreeDFormat object to set or return the type of top (or bottom) bevel, as per the constants defined in MsoBevelType Enumeration which correspond to the 12 bevel presets in Excel. To turn off the bevel, use the msoBevelNone constant. In charts mostly the Top face of a chart element is visible wherein you will use the BevelTopType Property, but in some cases of 3-D rotation the Bottom face of a chart element may be visible. Syntax: objThreeDFormat.BevelTopType or objThreeDFormat.BevelBottomType.
Bevel Width & Height:
You can further manipulate the bevel, and set the width & height of the bevel using the BevelTopInset & BevelTopWidth values respectively. In other words, this means setting the width & height of the raised edge at the top / bottom of a shape. Use the BevelTopInset Property (or the BevelBottomInset Property) of the ThreeDFormat object, to set or return a value to determine the top (or bottom) insert bevel to be raised – Syntax: objThreeDFormat.BevelTopInset or objThreeDFormat.BevelBottomInset. Use the BevelTopDepth Property (or the BevelBottomDepth Property) of the ThreeDFormat object, to set or return the top (or bottom) depth when a bevel effect is used – Syntax: objThreeDFormat.BevelTopDepth or objThreeDFormat.BevelBottomDepth. These properties use a Single Data Type for values.
Extrusion Color, Depth & Direction:
Normally, the extrusion color of a shape is based on the color of the shape’s fill which is the front face of the extrusion. The extrusion color will change automatically when the shape’s fill color changes. If you specifically want to control the extrusion color and make it independent of the shape’s fill, use the ExtrusionColorType Property of the ThreeDFormat object. Syntax: objThreeDFormat.ExtrusionColorType. To use this property, specify a constant defined as per the MsoExtrusionColorType Enumeration – msoExtrusionColorAutomatic for the Extrusion color to be based on shape fill, or msoExtrusionColorCustom for the Extrusion color to be independent of shape fill.
Use the SetExtrusionDirection Method of the ThreeDFormat object to set the direction of extrusion for a shape – Syntax: objThreeDFormat.SetExtrusionDirection((PresetExtrusionDirection). The PresetExtrusionDirection argument specifies the extrusion direction as per the defined MsoPresetExtrusionDirection constants – msoExtrusionLeft, msoExtrusionRight, msoExtrusionTop, msoExtrusionBottom, msoExtrusionBottomLeft, msoExtrusionBottomRight, msoExtrusionTop, msoExtrusionTopLeft, msoExtrusionTopRight, msoPresetExtrusionDirectionMixed & msoExtrusionNone. To extend the extrusion for a shape towards the bottom left, specify the constant msoExtrusionBottomLeft. This Method changes the sweep path direction of the extrusion without rotating the extrusion’s front face.
After you have specified that the extrusion color type is custom by using the constant msoExtrusionColorCustom for the ExtrusionColorType Property, use the ExtrusionColor Property of the ThreeDFormat object to set the color of the shape’s extrusion – Syntax: objThreeDFormat.ExtrusionColor. For this you can specify either a theme color or a RGB color for the extrusion. You can also adjust the amount of extrusion by specifying the depth in points. Use the Depth Property of the ThreeDFormat object – Syntax: objThreeDFormat.Depth – to set or return a value (Single) which represents the extrusion’s depth. The value can be within a range of -600 to 9600 – positive values produce an extrusion whose front face is the original shape; negative values produce an extrusion whose back face is the original shape.
Example: 3-D formatting (Bevel) for Chart Area, Plot Area & Series Markers, for an embedded chart – refer Image 10
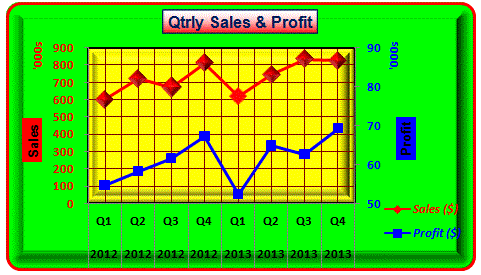
Sub Bevel_ChartArea_PlotArea_SeriesPoints()
‘3-D formatting (Bevel) for Chart Area, Plot Area & Series Markers, for an embedded chart (chart type: Line with Markers – xlLineMarkers) – refer Image 10
Dim wsChart As Worksheet
Dim oChObj As ChartObject
Set wsChart = Sheets(“Sheet8”)
Set oChObj = wsChart.ChartObjects(1)
With oChObj.Chart
‘—————————-
‘CHART AREA
With .ChartArea.Format
.Fill.ForeColor.RGB = RGB(0, 255, 0)
‘indicates the ThreeDFormat object is visible
.ThreeD.Visible = msoTrue
‘set type of top bevel
.ThreeD.BevelTopType = msoBevelConvex
‘set the width & height of the bevel using the BevelTopInset & BevelTopWidth values respectively – this means setting the width & height of the raised edge at the top of a shape
‘set width to 14 points
.ThreeD.BevelTopInset = 14
‘set height to 16 points
.ThreeD.BevelTopDepth = 16
End With
‘—————————-
‘PLOT AREA
With .PlotArea.Format
.Fill.ForeColor.RGB = RGB(255, 255, 0)
.ThreeD.Visible = msoTrue
.ThreeD.BevelTopType = msoBevelArtDeco
.ThreeD.BevelTopInset = 12
.ThreeD.BevelTopDepth = 16
End With
‘—————————-
‘SERIES 1
Dim pt As Point
With .SeriesCollection(1)
‘using the MarkerSize property of the Series object to set the data-marker size, in points
.MarkerSize = 12
For Each pt In .Points
‘set type of top bevel to msoBevelCircle, for each point / marker
With pt.Format
.ThreeD.Visible = msoTrue
.ThreeD.BevelTopType = msoBevelCircle
.ThreeD.BevelTopInset = 16
.ThreeD.BevelTopDepth = 12
End With
Next
‘turn off the bevel for pint no 5, using the msoBevelNone constant
With .Points(5).Format
.ThreeD.BevelTopType = msoBevelNone
End With
End With
End With
End Sub
Surface:
To set or return the extrusion surface material use the PresetMaterial Property of the ThreeDFormat object, as per the defined MsoPresetMaterial constants – Syntax: objThreeDFormat.PresetMaterial. Out of the 15 constants, 11 correspond to the presets available in Excel in the Material drop-down menu from the 3-D Format category of the Format Shape dialog.
To set or return the extrusion lighting effect preset of an object, use the PresetLighting Property of the ThreeDFormat object, specifying a constant defined in MsoLightRigType Enumeration – Syntax: objThreeDFormat.PresetLighting. Out of the 28 constants, 15 correspond to the presets available in Excel in the Lighting drop-down menu from the 3-D Format category of the Format Shape dialog, and 13 are Legacy settings (Excel 2003) reflected in the constant name itself. Lighting effect will not be visible for an extrusion with a wire frame surface.
MsoLightRigType Enumeration (Value & Description within brackets): msoLightRigLegacyFlat1 to msoLightRigLegacyFlat4 (1 to 4 – LegacyFlat1 to LegacyFlat4 effect), msoLightRigLegacyNormal1 to msoLightRigLegacyNormal4 (5 to 8), msoLightRigLegacyHarsh1 to msoLightRigLegacyHarsh4 (9 to 12), msoLightRigThreePoint (13 – ThreePoint effect), msoLightRigBalanced (14 – Balanced effect), msoLightRigSoft (15 – Soft effect), msoLightRigHarsh (16 – Harsh effect), msoLightRigFlood (17 – Flood effect), msoLightRigContrasting (18 – Contrasting effect), msoLightRigMorning (19 – Morning effect), msoLightRigSunrise (20 – Sunrise effect), msoLightRigSunset (21 – Sunset effect), msoLightRigChilly (22 – Chilly effect), msoLightRigFreezing (23 – Freezing effect), msoLightRigFlat (24 – Flat effect), msoLightRigTwoPoint (25 – TwoPoint effect), msoLightRigGlow (26 – Glow effect), msoLightRigBrightRoom (27 – BrightRoom effect), msoLightRigMixed (-2 – Mixed effect – Legacy setting).
Use the PresetLightingDirection Property of the ThreeDFormat object to set or return the direction of light source for an extrusion – Syntax: objThreeDFormat.PresetLightingDirection. You can specify the direction using the defined MsoPresetLightingDirection constants – msoLightingLeft, msoLightingRight, msoLightingTop, msoLightingBottom, msoLightingBottomLeft, msoLightingBottomRight, msoLightingTop, msoLightingTopLeft, msoLightingTopRight, msoPresetLightingDirectionMixed & msoLightingNone. To specify the extrusion lighting to come from the the bottom left, specify the constant msoLightingBottomLeft. To set or return the intensity of the extrusion lighting, use the ThreeDFormat.PresetLightingSoftness Property by specifying a MsoPresetLightingSoftness constant – msoLightingBright, msoLightingDim, msoLightingNormal & msoPresetLightingSoftnessMixed.
Use the LightAngle Property of the ThreeDFormat object to set or return the angle of the extrusion light. Syntax: objThreeDFormat.LightAngle. Use a Single value type for this property.
Example: Add an embedded 3D chart, without any 3D formatting – refer Image 11a
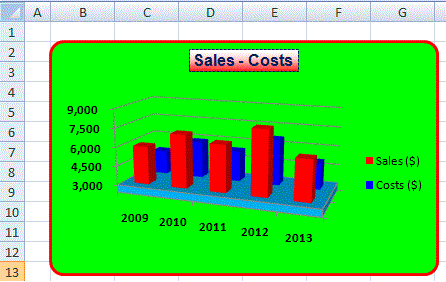
Sub ChartCreate_3D()
‘Add an embedded 3D chart, without any 3D formatting – refer Image 11a
Dim rngSourceData As Range, wsData As Worksheet, wsChart As Worksheet
Set wsData = Sheets(“Sheet6”)
Set wsChart = Sheets(“Sheet9”)
Set rngSourceData = wsData.Range(“B13:C18”)
‘————————————–
‘ADD CHART:
‘declare a ChartObject
Dim oChObj As ChartObject
‘the Add method (of the ChartObjects object) is used to create a new empty embedded chart and add it to the collection (ChartObjects object) in the specified sheet – left edge align to the left edge of column B, top edge align to the
top of row 2
Set oChObj = wsChart.ChartObjects.Add(Left:=wsChart.Columns(“B”).Left, Width:=290, Top:=wsChart.Rows(2).Top, Height:=175)
‘set the embedded chart to be free-floating so that it does not move or size with its underlying cells
oChObj.Placement = xlFreeFloating
‘set rounded corners for the embedded chart
oChObj.RoundedCorners = True
‘set the name of the embedded chart to “AnnualSalesCosts” using the Name Property
oChObj.Name = “AnnualSalesCosts“
‘using the Chart Property of the ChartObject object returns a Chart object which refers to a chart
With oChObj.Chart
‘use ChartType Property of the Chart object to set type of chart – 3D Column
.ChartType = xl3DColumn
‘use SetSourceData Method of the Chart object to set the range of source data for the chart
.SetSourceData Source:=rngSourceData, PlotBy:=xlColumns
‘the ChartTitle object exists and can be used only if the HasTitle property (of the Chart object) is True
.HasTitle = True
‘————————————–
‘CHART TITLE:
‘the ChartTitle object represents the chart title
With .ChartTitle
‘set the text for the chart title, using the Text Property of the ChartTitle object
.Text = “Sales – Costs“
‘set the font to Bold Arial 12 point
.Font.Name = “Arial“
‘set font color to dark blue
.Font.Color = RGB(0, 30, 90)
.Font.Size = 12
.Font.Bold = True
‘Format property of the ChartTitle returns returns the ChartFormat object – using the Fill Property of the ChartFormat object to return a FillFormat object, to set the fore color & gradient for the ChartTitle
‘the FillFormat object contains fill formatting properties for the parent chart element
.Format.Fill.ForeColor.RGB = RGB(255, 0, 0)
‘the OneColorGradient Method of the FillFormat object, sets a one-color gradient for the specified fill – specifying the style for a gradient fill with the MsoGradientStyle Enumeration ‘msoGradientHorizontal’ for a Gradient running
horizontally across the shape.
‘gradient variant of 2 & gradient degree of 1 (lightest)
.Format.Fill.OneColorGradient msoGradientHorizontal, 2, 1
‘use the LineStyle Property of the Border object to set a line style for the border – use the XlLineStyle Enumeration of xlDot to set a dotted line – note that xlDouble & xlSlantDashDot in XlLineStyle Enumeration do not apply to charts
.Border.LineStyle = xlDot
‘use the Weight Property of the Border object to set the border weight – use the XlBorderWeight Enumeration of xlThin for specifying the weight of the border as Thin
.Border.Weight = xlThin
‘set border color with Color Property of the Border object – dark blue
.Border.Color = RGB(0, 30, 90)
End With
‘————————————–
‘CHART AREA:
‘using the ChartArea Property of the Chart object returns the ChartArea object which represents the chart area
With .ChartArea
‘the Format Property of the ChartArea object returns the ChartFormat object, and the Line Property of the ChartFormat object returns a LineFormat object that contains line formatting properties for the specified Chart Area – for a
chart with a border, the LineFormat object represents the border
‘turn on the border for the chart area
.Format.Line.Visible = True
‘using the Weight Property of the LineFormat object, to set the weight of the border
.Format.Line.Weight = 2
‘using the Fill Property of the ChartFormat object returns a FillFormat object, that contains fill formatting properties for the for the ChartArea object. Then use the ForeColor Property to return a ColorFormat object to specify the
foreground fill or solid color to green
.Format.Fill.ForeColor.RGB = RGB(0, 255, 0)
‘use the ColorIndex Property of the Border object to set the border color: to set no line color use ColorIndex = xlNone, or use ColorIndex 3 for red, 5 for blue, 4 for green, 6 for yellow, and so on.
.Border.ColorIndex = 3
.Border.LineStyle = xlContinuous
End With
‘————————————–
‘VERTICAL Y-AXIS, PRIMARY:
‘refer the Axis object – Value axis in the Primary axis group – Axis object is a member of the Axes collection
With .Axes(xlValue, xlPrimary)
‘set the minimum and maximum values for the value axis
.MinimumScale = 3000
.MaximumScale = 9000
.MajorUnit = 1500
With .TickLabels
.Font.Bold = True
End With
End With
‘————————————–
‘HORIZONTAL X-AXIS, PRIMARY:
With .Axes(xlCategory, xlPrimary)
.CategoryNames = wsData.Range(“A14:A18”)
.TickLabels.Font.Bold = True
End With
‘———————————————-
‘SERIES
‘using the Chart.SeriesCollection Method to return a single series (Series object) by its Index number
With .SeriesCollection(1)
‘set series1 color to red
.Format.Fill.ForeColor.RGB = RGB(255, 0, 0)
End With
With .SeriesCollection(2)
‘set series2 color to blue
.Format.Fill.ForeColor.RGB = RGB(0, 0, 255)
End With
‘—————————-
‘FLOOR
‘the Floor property of the Chart object returns the Floor object, which represents the floor of a 3-D chart
With .Floor
‘set the thickness of the floor using the Thickness Property
.Thickness = 10
‘set the floor color to light blue
.Interior.Color = RGB(0, 176, 240)
End With
‘———————————————-
‘DEPTH AXIS
‘depth (series) axis
With .Axes(xlSeriesAxis, xlPrimary)
‘set No Axis Labels for depth axis
.TickLabelPosition = xlNone
End With
‘returns 3 – xlValue, xlCategory & xlSeriesAxis, all are xlPrimary AxisGroup
MsgBox .Axes.count
End With
End Sub
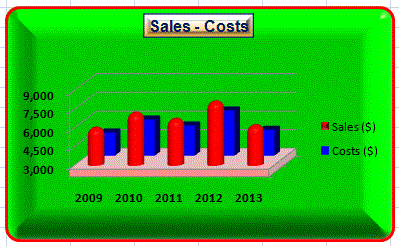
Example: ThreeD formatting – Bevel & Extrusion Surface – for Chart Area, Chart Title, Floor & Series – refer Image 11b (continued from Image 11a)
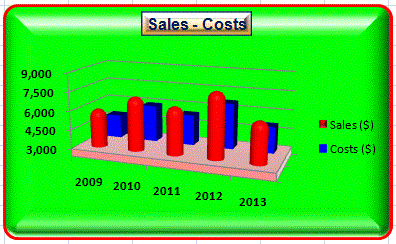
Sub ThreeDFormat_Bevel_Surface()
‘continued from Image 11a
‘ThreeD formatting – Bevel & Extrusion Surface – for Chart Area, Chart Title, Floor & Series – refer Image 11b
Dim wsChart As Worksheet
Dim oChObj As ChartObject
Set wsChart = Sheets(“Sheet9”)
Set oChObj = wsChart.ChartObjects(1)
With oChObj.Chart
‘—————————-
‘CHART AREA
With .ChartArea.Format
‘the ThreeDFormat object is visible
.ThreeD.Visible = msoTrue
‘use the BevelTopType Property of the ThreeDFormat object to set the type of top bevel, as per the constants defined in MsoBevelType Enumeration: msoBevelCircle, msoBevelSlope, msoBevelSoftRound, msoBevelConvex, …
.ThreeD.BevelTopType = msoBevelCircle
‘set the width & height of the bevel using the BevelTopInset & BevelTopWidth values respectively – this means setting the width & height of the raised edge at the top of a shape
‘set width to 25 points
.ThreeD.BevelTopInset = 25
‘set height to 20 points
.ThreeD.BevelTopDepth = 20
‘set the surface material for the extrusion, as per the defined MsoPresetMaterial constants: msoMaterialSoftEdge, msoMaterialDarkEdge, msoMaterialMetal2, msoMaterialPowder, …
.ThreeD.PresetMaterial = msoMaterialMetal2
End With
‘—————————-
‘CHART TITLE
With .ChartTitle.Format
.Fill.ForeColor.RGB = RGB(255, 192, 0)
.ThreeD.Visible = msoTrue
.ThreeD.BevelTopType = msoBevelConvex
End With
‘—————————-
‘FLOOR
With .Floor
.Interior.Color = RGB(255, 0, 0)
.Format.ThreeD.PresetMaterial = msoMaterialPowder
End With
‘—————————-
‘CHART SERIES
‘series 1
With .SeriesCollection(1).Format.ThreeD
.Visible = True
.BevelTopType = msoBevelCircle
.BevelTopInset = 8
.BevelTopDepth = 8
End With
‘series 2
With .SeriesCollection(2).Format.ThreeD
.Visible = True
.PresetMaterial = msoMaterialDarkEdge
End With
End With
End Sub
Example: ThreeD formatting – Extrusion Preset Camera & Preset Lighting – refer Image 11c (continued from Image 11b)
Sub ThreeDFormat_PresetLighting_PresetCamera()
‘continued from Image 11b
‘ThreeD formatting – Extrusion Preset Camera & Preset Lighting – refer Image 11c
Dim wsChart As Worksheet
Dim oChObj As ChartObject
Set wsChart = Sheets(“Sheet9”)
Set oChObj = wsChart.ChartObjects(1)
With oChObj.Chart
With .ChartArea.Format
‘set the extrusion preset lighting, as per the defined MsoLightRigType constants: msoLightRigThreePoint, msoLightRigMorning, msoLightRigSunrise, msoLightRigSunset, msoLightRigFreezing, …
.ThreeD.PresetLighting = msoLightRigSunrise
‘the extrusion to be lit brightly from the bottom
‘set the intensity of the extrusion lighting, as per the defined MsoPresetLightingSoftness constants: msoLightingBright, msoLightingDim, msoLightingNormal, msoPresetLightingSoftnessMixed
.ThreeD.PresetLightingSoftness = msoLightingBright
‘set the position of the light source relative to the extrusion, as per the defined MsoPresetLightingDirection constants: msoLightingBottom, msoLightingTop, msoLightingRight, msoLightingLeft, …
.ThreeD.PresetLightingDirection = msoLightingBottom
End With
With .Floor.Format
‘specify the extrusion preset camera, as per the defined MsoPresetCamera constants: msoCameraIsometricBottomDown, msoCameraIsometricBottomUp, msoCameraIsometricRightDown, msoCameraLegacyPerspectiveFront,
msoCameraIsometricOffAxis3Left, msoCameraLegacyObliqueTop, …
.ThreeD.SetPresetCamera msoCameraIsometricBottomDown
End With
End With
End Sub
3-D Rotation:
Explicitly Set or Change the Rotation of the extruded shape:
Use the RotationX Property of the ThreeDFormat object to set or return the rotation of the extruded shape around the x-axis, in degrees, from -90 to +90, with a +ive value meaning upward rotation and a -ive value indicating downward rotation. Syntax: objThreeDFormat.RotationX. Use the RotationY Property of the ThreeDFormat object to set or return the rotation of the extruded shape around the y-axis, in degrees, from -90 to +90, with a +ive value meaning rotation to the left and a -ive value indicating rotation to the right. Syntax: objThreeDFormat.RotationY. Use the RotationZ Property of the ThreeDFormat object to set or return the rotation of the extruded shape around the z-axis, in degrees, from -90 to +90, with a +ive value meaning upward rotation and a -ive value indicating downward rotation. Syntax: objThreeDFormat.RotationZ.
The RotationX / RotationY / RotationZ Properties sets the absolute rotation around the axis, and to determine by how much the rotation is to be changed ie. the incremental rotation, use the IncrementRotationX /IncrementRotationY /IncrementRotationZ Methods. Use the IncrementRotationX Method of the ThreeDFormat object to change the rotation of the extruded shape around the x-axis, by the specified degrees. Syntax: objThreeDFormat.IncrementRotationX(Increment). The Increment argument specifies by how much the rotation is to be changed, in degrees, and can be a value from -90 to +90, with a positive value indicating an upward tilt & a negative value indicating a downward tilt. It may be noted that the absolute rotation has to be within the range of -90 & +90 degrees, so that using the RotationX Property initially to rotate by 60 degrees will limit the incremental rotation to 30 degrees more even though you might specify a value of 50 for the IncrementRotationX Method. Use the IncrementRotationY & IncrementRotationZ Methods similarly, to change the rotation around the y-axis & z-axis respectively, and in both cases a positive value indicating a tilt towards the left & a negative value indicating a tilt towards the right.
Use the IncrementRotationHorizontal Method of the ThreeDFormat object to change the rotation of the extruded shape horizontally, in degrees. Syntax: objThreeDFormat.IncrementRotationHorizontal(Increment). The Increment argument specifies by how much the rotation is to be changed, in degrees, and can be a value from -90 to +90, with a positive value moving to the left & a negative value moving to the right. Use the IncrementRotationVertical Method similarly, to change the rotation of the extruded shape vertically, by the specified degrees.
Use the Perspective Property of the ThreeDFormat object to set or return a value to determine for the extrusion to appear in perspective where the walls of the extrusion narrow toward a vanishing point, or not ie. where the extrusion is parallel and the walls do not narrow toward a vanishing point. Syntax: objThreeDFormat.Perspective. Use the value -1 or the constant msoTrue for the extrusion to appear in perspective, and use the value 0 or the constant msoFalse for the extrusion to NOT appear in perspective. When the extrusion is set to appear in perspective, you can set or return the angle of view, in degrees (degree of perspective between 0.1 to 100), using the FieldOfView Property of the ThreeDFormat object – Syntax: objThreeDFormat.FieldOfView.
Apply the 3-D Rotation Presets available in VBA:
Above we have explained how you can explicitly set or change the rotation of the extruded shape around the x-axis, y-axis or horizontally / vertically. You can also apply the 3-D presets available in vba (62 presets) to chart-elements, which include the Excel 3-D Rotation presets available in the Shape Effects dropdown under the Format tab (25 presets) . There are 37 more presets available in vba, which include 18 Legacy/Excel 2003 presets plus19 extra presets.
Use the SetPresetCamera Method of the ThreeDFormat object to set a camera for a chart element – Syntax: objThreeDFormat.SetPresetCamera(PresetCamera). The PresetCamera argument is necessary, and it specifies the preset camera ie. a 3-D rotation preset, as per the preset constants (which indicate the extrusion camera type) defined in the MsoPresetCamera Enumeration, viz. msoCameraLegacyObliqueTopLeft, msoCameraLegacyObliqueTop, msoCameraLegacyObliqueTopRight, msoCameraLegacyPerspectiveTopLeft, msoCameraLegacyPerspectiveTop, msoCameraLegacyPerspectiveRight, msoCameraIsometricTopUp, msoCameraIsometricRightDown, msoCameraObliqueTopLeft, msoCameraPerspectiveBelow, msoCameraPerspectiveRelaxed, …
3-D chart view using Properties of the Chart object
Use the Perspective Property of the Chart object to set or return the perspective for the 3-D chart view. You can use a Long value in the range of 0 to 100 for this property. Syntax: objChart.Perspective. If the RightAngleAxes property is set to True, the Perspective Property will have no effect. Use the RightAngleAxes Property of the Chart object to determine if the chart axes are at right angles. Use a Boolean value for this property, so that using True will set the axes to intersect at right angles. This property is not dependent on or affected by chart rotation or elevation, and it is valid only for 3-D Line, Column & Bar charts. Syntax: objChart.RightAngleAxes.
Use the Elevation Property of the Chart object to set or return the chart elevation (for a 3-D chart), in degrees. The chart elevation means the elevation of the 3-D chart view, which is the height at which the chart is viewed. Default elevation of a new chart is 0 degrees – you can tilt the chart up by changing the chart elevation to say, 25 degrees. You can use a value within a range of -90 to 90 degrees, except for 3-D Bar charts wherein the range should be between 0 to 44. For most charts the default value is 15 degrees. Syntax: objChart.Elevation.
Use the Rotation Property of the Chart object to set or return the rotation of the 3-D chart view, in degrees. The rotation of the 3-D chart view means the rotation of the plot area around the z-axis (the depth axis). You can turn a chart around & around by changing the value of the Rotation property. You can use a value within a range of 0 to 360 degrees, except for 3-D Bar charts wherein the range should be between 0 to 44. For most charts the default value is 20 degrees. Syntax: objChart.Rotation. Note that rotation value is rounded to the nearest integer.
Use the DepthPercent Property of the Chart object to set or return a 3-D chart’s depth as a percentage of its width. You can use a Long value within a range of 20 to 2000 percent – Syntax: objChart.DepthPercent. Chart.DepthPercent = 40 will set the depth of the 3-D chart as 40% of the chart’s width. Use the HeightPercent Property of the Chart object to set or return a 3-D chart’s height as a percentage of the chart’s width. You can use a Long value within a range of 5 to 500 percent – Syntax: objChart.HeightPercent. Chart.HeightPercent = 40 will set the height of the 3-D chart as 40% of the chart’s width.
Use the Floor property of the Chart object to return the Floor object, which represents the floor of a 3-D chart – Syntax: objChart.Floor. You can thus manipulate the Floor object to set the thickness of the floor (Floor.Thickness Property), use formatting (Floor.Format Property), set the floor color – Floor.Interior.Color = RGB(255, 0, 0) – and so on.
Example: 3DRotation: RotationX, RotationY, IncrementRotationX, IncrementRotationY, Perspective, FieldOfView, Rotation, DepthPercent – refer Image 11d
To download Excel file with live code, click here.
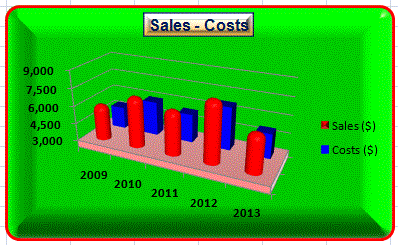
Sub ThreeDFormat_3DRotation()
‘continued from Image 11c
‘3DRotation: RotationX, RotationY, IncrementRotationX, IncrementRotationY, Perspective, FieldOfView, Rotation, DepthPercent – refer Image 11d
Dim wsChart As Worksheet
Dim oChObj As ChartObject
Set wsChart = Sheets(“Sheet9”)
Set oChObj = wsChart.ChartObjects(1)
With oChObj.Chart
With .ChartArea.Format.ThreeD
‘-20 (20 degrees)
MsgBox .RotationX
‘105 (15 degrees)
MsgBox .RotationY
‘0 (False)
MsgBox .Perspective
.Visible = msoTrue
‘set incremental rotation, using the IncrementRotationX Method of the ThreeDFormat object to change the rotation round the x-axis, by -10 degrees, with a positive value indicating an upward tilt & a negative value indicating a
downward tilt.
.IncrementRotationX (-10)
‘returns -30 (30 degrees)
MsgBox .RotationX
‘set incremental rotation, using the IncrementRotationY Method of the ThreeDFormat object to change the rotation round the y-axis, by 7 degrees, with a positive value indicating a tilt towards the left & a negative value indicating a a
tilt towards the right.
.IncrementRotationY (7)
‘returns 112 (22 degrees)
MsgBox .RotationY
‘set the rotation of the extrusion around the x-axis, in degrees, from -90 to +90, with a +ive value meaning upward rotation and a -ive value indicating downward rotation.
.RotationX = -35
‘set the rotation of the extrusion around the y-axis, in degrees, from -90 to +90, with a +ive value meaning rotation to the left & a -ive value indicating rotation to the right.
.RotationY = 115
‘returns -35 (35 degrees)
MsgBox .RotationX
‘returns 115 (25 degrees)
MsgBox .RotationY
‘set the extrusion to appear in perspective ie. the walls of the extrusion narrow toward a vanishing point
.Perspective = msoTrue
‘returns -1 (True)
MsgBox .Perspective
‘returns 15
MsgBox .FieldOfView
‘set the angle at which the depth axis floor can be viewed
.FieldOfView = 20
‘returns 20 (20 degrees)
MsgBox .FieldOfView
End With
‘returns 35
MsgBox .Rotation
‘returns 100
MsgBox .DepthPercent
‘Rotation Property of the Chart object – set the rotation of the 3-D chart view, in degrees, indicating the rotation of the plot area around the z-axis (the depth axis)
.Rotation = 25
‘DepthPercent Property of the Chart object – set the depth of the 3-D chart as a percentage of the chart’s width
.DepthPercent = 87
‘returns 25
MsgBox .Rotation
‘returns 87
MsgBox .DepthPercent
End With
End Sub

